Food Safety Analysis

Written by Joseph E. Goznalez

jegonzal@cs.berkeley.edu

This analysis is inspired by Jonathan Dinu's excellent post: https://github.com/hopelessoptimism/happy-healthy-hungry/blob/master/h3.ipynb

Motivation

Have you ever seen one of these signs?

  • Have you ever wondered what it means?

  • Is this a safe place to eat?

  • What does a score of 90 mean?

In this lecture we will explore food safety ratings for San Francisco to get a better picture of what these ratings mean.

Thinking about Questions

Before we start, let's spend a few minutes thinking about the questions that we want to answer.

  1. What is a good restaurant score for food safety inspections?

  2. What are common issues with restaurants that could be better addressed?

  3. Are there regions of the city sub-par?

  4. Is the situation getting worse or better?

What are some other questions that we might want to answer?

Where can we get data?

Description of inspection data for SF:

https://www.sfdph.org/dph/EH/Food/Score/

  1. Yelp LIVES site: https://www.yelp.com/healthscores
  2. Data description: https://www.yelp.com/healthscores#businesses
  3. Downloading data from various locations: https://www.yelp.com/healthscores/feeds

Getting the data

I downloaded several feeds and stored them in the local data folder. Lets first see what files we downloaded data/san_francisco

In [1]:
ls -lh data/san_francisco/
total 9904
-rwxr-xr-x  1 jegonzal  staff   645K Jan  1 20:50 businesses.csv*
-rwxr-xr-x  1 jegonzal  staff   493K Jan  1 20:50 inspections.csv*
-rwxr-xr-x  1 jegonzal  staff   120B Jan  1 20:50 legend.csv*
-rwxr-xr-x  1 jegonzal  staff   3.7M Jan  1 20:50 violations.csv*

There is data for other cities as well but we will focus on San Francisco for today.

Questions

  1. How big is the data?
  2. File types?

Looking at the data

Data scientists will often use many tools to better understand the data.

The first set of tools we might use are command line utilities:

  • head -n 5: read the first 5 lines of a file
  • wc: Compute the number of lines (records) in a file.

We can use these command line utilities from within the python notebook. This is done by prefixing each command with the "bang" operator !

Using Head

Using head gives us a better picture of the contents of the businesses.csv file:

In [2]:
! head data/san_francisco/businesses.csv


In [3]:
!head -n 3 ./data/san_francisco/inspections.csv


In [4]:
!head -n 3 ./data/san_francisco/violations.csv


Use cat to read the entire file

In [5]:
!cat ./data/san_francisco/legend.csv


The legend indicates what ranges of scores mean. For example, this suggests that poor quality restaurants will have scores at or below 70.

What is Jupyter

Environment for describing analysis and doing analysis

Use man to learn

To learn more about these commands try:

In [6]:
man cat

In [7]:
# man cat

press esc to clear the pane.

What have we learned so far?


  1. The first line of the file defines the header of the table.
  2. These files consist of comma separated values (CSV).
  3. All the fields appear to be quoted (this will be helpful in parsing the file).
  4. The business_id field seems to appear in multiple files and is probably unique in businesses?
  5. We can get a sense for the kind of information in each file (though we should definitely read the documentation)

How big is the data?

We already looked at the raw file size:

In [8]:
!ls -Rlh data/san_francisco/
total 9904
-rwxr-xr-x  1 jegonzal  staff   645K Jan  1 20:50 businesses.csv
-rwxr-xr-x  1 jegonzal  staff   493K Jan  1 20:50 inspections.csv
-rwxr-xr-x  1 jegonzal  staff   120B Jan  1 20:50 legend.csv
-rwxr-xr-x  1 jegonzal  staff   3.7M Jan  1 20:50 violations.csv
  1. Why might we want to know the size of the data?
  2. Why don't we just load it into python?

This dataset is fairly small but in general the data we study may be large (e.g., too big to easily manipulate in memory).

How Many Record?

  1. How many records or observations do we have?
  2. Can we answer this question just from the size of the file?

In the following we write a small bash script to calculate the number of lines each file.

In [9]:
%%bash
# We can use ipython Magic commands to 
# evaluate the entire cell in bash
for f in $(ls -R data/san_francisco/*); do
    wc $f
done;
    6316   44398  660035 data/san_francisco/businesses.csv
   15431   15431  505325 data/san_francisco/inspections.csv
       5       6     120 data/san_francisco/legend.csv
   40937  432008 3891639 data/san_francisco/violations.csv

The wc command prints the number of lines, words, and characters respectively in the file.

To learn more about this command run:

In [10]:
man wc

Press esc to close the popup pane.

Counting Lines in Python (Skip in Class)

In DS100 we will be using Python to do a lot of our analysis.

How could we write a similar program in Python?

for f in $(ls -R data/san_francisco/*); do
    wc $f
done;
In [11]:
import os
for fname in os.listdir("data/san_francisco"):
    with open(os.path.join("data/san_francisco", fname), "rb") as f:
        lines = sum(1 for line in f)
        print("Lines in", fname, ":", lines)
Lines in businesses.csv : 6316
Lines in inspections.csv : 15431
Lines in legend.csv : 5
Lines in violations.csv : 40937

The above Python program demonstrates a few big ideas:

  1. programmatically traversing the file systems with os.listdir
  2. using a with expression to open (and then automatically close) a file.
  3. using a generator (the expression sum(1 for line in f)) to count the number of lines without first loading the entire file in memory.

A quick note on file size

When we load data into a program it will often increase in size. Therefore we need to be careful when loading entire files:

In [12]:
import sys

with open("data/san_francisco/violations.csv", "r") as f:
    lines = f.readlines()
In [13]:
print("Size of list container:", 
      sys.getsizeof(lines) / (10. ** 6) , 
      "MBytes")
Size of list container: 0.342696 MBytes
In [14]:
print("Sum of lines objects:", 
      sum(sys.getsizeof(l) for l in lines) / (10. ** 6), 
      "MBytes")
Sum of lines objects: 5.856615 MBytes
In [15]:
!ls -Rlh data/san_francisco/violations.csv
-rwxr-xr-x  1 jegonzal  staff   3.7M Jan  1 20:50 data/san_francisco/violations.csv

First note that the file takes a little more space in memory than it did on disk. Why?


This is because the data structures to store the contents of the file may contain extra fields (e.g., length and points) that add additional overhead.

Data scientists need to think about computational issues:

  1. Can we fit the data in memory?
  2. How long will this analysis take to run?

This is why knowing the size of the file can be important before loading it.

Iterating (Skip in Class)

What if I wanted to know the number of unique businesses in the violations.csv file without loading the entire file into memory at once?

In [16]:
business_ids = set()
with open("data/san_francisco/violations.csv", "r") as f:
    next(f)
    for line in f:
        business_ids.add(int(line.split(",")[0]))
In [17]:
print("There are", len(business_ids), "unique business ids.")
There are 5259 unique business ids.

Interesting there are fewer businesses in the violations.csv file than there are lines in the businesses.csv file. Perhaps there are no violations for some businesses? Let's check to see how many unique business_ids are in the businesses.csv file.

To do this we will practice using bash commands instead.

A little more with bash commands

Could we have computed the number of unique businesses using just Bash commands?

  1. tail returns the end of the file.
    tail -n +2
    
    skips the first line of the file.
  2. cat reads the entire file
  3. cut extracts a field from row.
    cut -f 1 -d ","
    
    extracts the first field from a line delimited by commas.
  4. sort sorts the input
  5. uniq returns the unique entries form a sorted input
  6. wc as earlier counts the entries in the output.

We can compose multiple operations using | (pipe).

In [18]:
%%bash
tail -n +2 data/san_francisco/businesses.csv | head -n 5
10,"TIRAMISU KITCHEN","033 BELDEN PL","San Francisco","CA","94104","37.791116","-122.403816","+14154217044"
19,"NRGIZE LIFESTYLE CAFE","1200 VAN NESS AVE, 3RD FLOOR","San Francisco","CA","94109","37.786848","-122.421547","+14157763262"
24,"OMNI S.F. HOTEL - 2ND FLOOR PANTRY","500 CALIFORNIA ST, 2ND  FLOOR","San Francisco","CA","94104","37.792888","-122.403135","+14156779494"
31,"NORMAN'S ICE CREAM AND FREEZES","2801 LEAVENWORTH ST ","San Francisco","CA","94133","37.807155","-122.419004",""
45,"CHARLIE'S DELI CAFE","3202 FOLSOM ST ","San Francisco","CA","94110","37.747114","-122.413641","+14156415051"
In [19]:
%%bash
tail -n +2 data/san_francisco/businesses.csv \
    | cut -f 1 -d "," \
    | head -n 10
10
19
24
31
45
48
50
54
56
58
cut: stdin: Illegal byte sequence

The above error occurs because the file is encoded in a non UTF-8 string format. In general this is often the older ISO format ISO-8859-1. We can use iconv to clean up the file.

In [20]:
man iconv
In [21]:
!tail -n +2 data/san_francisco/businesses.csv \
    | iconv -t UTF-8 -f ISO-8859-1 \
    | cut -f 1 -d "," \
    | head -n 10
10
19
24
31
45
48
50
54
56
58

Adding sort:

In [22]:
%%bash
tail -n +2 data/san_francisco/businesses.csv \
    | iconv -t UTF-8 -f ISO-8859-1 \
    | cut -f 1 -d "," \
    | sort \
    | head -n 10
10
1000
10011
1002
1003
10030
1005
1008
10083
10099

Adding uniq:

In [23]:
%%bash
tail -n +2 data/san_francisco/businesses.csv \
    | iconv -t UTF-8 -f ISO-8859-1 \
    | cut -f 1 -d "," \
    | sort \
    | uniq \
    | wc
    6315    6315   35738
In [24]:
man uniq

There is one less unique business_id than there are lines in the file. Why is that?

In DS-100 we will largely focus on analysis within Python. However, as a data scientist you may want to learn more about using these Bash shell commands (common to all POSIX shells). Others worth learning are:

  1. cd, ls, pwd, mkdir, and rm are file and folder traversal and manipulation commands.
  2. grep regular expression pattern matching
  3. tr change individual characters
  4. tee used to split an output down two paths
  5. awk a string processing framework with it's own built in language for string transformations.
  6. zip, gzip, bzip2, and tar are compression and archiving commands

The Pandas DataFrame Library

In this class we will frequently operate on data stored in table form. A common data structure for tabular data in analysis tools is a DataFrame.

Conceptually DataFrames behave like tables (in a Spreadsheet) with rows corresponding to data records and columns corresponding to fields. DataFrames are also like Matrices in that we can index a row or column of data. However, unlike Matrices DataFrames can store data of different types in each column.

Many of you may already be familiar with DataFrames from Data8. In Data8 you used a DataFrame library called DataScience created here at Berkeley. The Berkeley DataScience library contains a simple DataFrame data structure with a few basic operations. In contrast many of the DataFrame APIs in use today (e.g., Pandas, Spark, and R) have fairly extensive APIs with numerous short-cuts and optimizations.

One of the most commonly used DataFrame APIs today is the Python Pandas Library. This library was heavily inspired by the DataFrame concepts in the R programming language.

In DS100 we will the Pandas DataFrame library for many of the assignments. We encourage students to read a little about Pandas here

Loading the DataFrame

One of the useful features of Pandas is its ability to load fairly messy "CSV" files:

In [25]:
import pandas as pd


# note the need to provide encoding information for this text file
bus = pd.read_csv("data/san_francisco/businesses.csv", 
                             encoding='ISO-8859-1')

ins = pd.read_csv("data/san_francisco/inspections.csv")

vio = pd.read_csv("data/san_francisco/violations.csv")

If you look at the pd.read_csv command you will see that it has a very large number of arguments:

In [26]:
pd.read_csv?

To get a sense as to how the data was processed lets look at the records in each of the DataFrame

In [27]:
print('Records:', len(bus))
bus.head()
Records: 6315
Out[27]:
business_id name address city state postal_code latitude longitude phone_number
0 10 TIRAMISU KITCHEN 033 BELDEN PL San Francisco CA 94104 37.791116 -122.403816 +14154217044
1 19 NRGIZE LIFESTYLE CAFE 1200 VAN NESS AVE, 3RD FLOOR San Francisco CA 94109 37.786848 -122.421547 +14157763262
2 24 OMNI S.F. HOTEL - 2ND FLOOR PANTRY 500 CALIFORNIA ST, 2ND FLOOR San Francisco CA 94104 37.792888 -122.403135 +14156779494
3 31 NORMAN'S ICE CREAM AND FREEZES 2801 LEAVENWORTH ST San Francisco CA 94133 37.807155 -122.419004 NaN
4 45 CHARLIE'S DELI CAFE 3202 FOLSOM ST San Francisco CA 94110 37.747114 -122.413641 +14156415051
In [28]:
print('Records:', len(ins))
ins.head()
Records: 15430
Out[28]:
business_id score date type
0 10 82 20160503 routine
1 10 94 20140729 routine
2 10 92 20140114 routine
3 19 94 20160513 routine
4 19 94 20141110 routine
In [29]:
print('Records:', len(vio))
vio.head()
Records: 40936
Out[29]:
business_id date description
0 10 20160503 High risk food holding temperature [ date vi...
1 10 20160503 High risk food holding temperature [ date vi...
2 10 20160503 High risk vermin infestation
3 10 20160503 Unapproved or unmaintained equipment or utensils
4 10 20160503 No thermometers or uncalibrated thermometers

Now that we have successfully loaded the data let's start to examine what we have.

Questions about data organization?

  1. How is the data organized?
    • What are the relationships between the tables (e.g., common attributes, keys)?
  2. Are there common data issues (e.g., missing values (NaN), date parsing)?
  3. How far does the data go back?
  4. others...
In [30]:
print("Bus(" + ", ".join(bus.columns) + ")")
print("Ins(" + ", ".join(ins.columns) + ")")
print("Vio(" + ", ".join(vio.columns) + ")")
Bus(business_id, name, address, city, state, postal_code, latitude, longitude, phone_number)
Ins(business_id, score, date, type)
Vio(business_id, date, description)

The business_id field is shared across tables

The business_id field connects records across each of the DataFrames. Later in the class we will discuss this form of foreign key relationship between tables. For now, we will construct a modified version of these tables that are indexed by the business_id. This will both speedup future operations and also provide an implicit join key.

In [31]:
bus.set_index('business_id', inplace=True)
ins.set_index('business_id', inplace=True)
vio.set_index('business_id', inplace=True)
In [32]:
vio.head()
Out[32]:
date description
business_id
10 20160503 High risk food holding temperature [ date vi...
10 20160503 High risk vermin infestation
10 20160503 Unapproved or unmaintained equipment or utensils
10 20160503 No thermometers or uncalibrated thermometers

Date Parsing

Both the inspections and violations tables have dates.

In [33]:
vio['date'].head(10)
Out[33]:
business_id
10    20160503
10    20160503
10    20160503
10    20160503
10    20160503
10    20140729
10    20140729
10    20140114
10    20140114
10    20140114
Name: date, dtype: int64

Notice the "type" of information stored in that column is an integer not a date. We need to clean that up a bit.

In [34]:
ins['date'] = pd.to_datetime(ins['date'], format="%Y%m%d")
vio['date'] = pd.to_datetime(vio['date'], format="%Y%m%d")
In [35]:
vio['date'].head(10)
Out[35]:
business_id
10   2016-05-03
10   2016-05-03
10   2016-05-03
10   2016-05-03
10   2016-05-03
10   2014-07-29
10   2014-07-29
10   2014-01-14
10   2014-01-14
10   2014-01-14
Name: date, dtype: datetime64[ns]

How far back do the inspections and violation reports go:

In [36]:
print("Oldest inspection:", ins['date'].min())
print("Oldest violation:", vio['date'].min())
Oldest inspection: 2013-12-26 00:00:00
Oldest violation: 2013-12-26 00:00:00
In [37]:
print("Most recent inspection:", ins['date'].max())
print("Most recent violation:", vio['date'].max())
Most recent inspection: 2016-12-23 00:00:00
Most recent violation: 2016-12-23 00:00:00

Digging into the Inspection Data

In [38]:
ins.head()
Out[38]:
score date type
business_id
10 82 2016-05-03 routine
10 94 2014-07-29 routine
10 92 2014-01-14 routine
19 94 2016-05-13 routine
19 94 2014-11-10 routine

It seems like there are possibly many routine inspections. Let's look at the distribution of inspection types. To do this we are going to select the type column and use the value_counts() function to count the occurrences:

In [39]:
ins['type'].value_counts()
Out[39]:
routine      15429
complaint        1
Name: type, dtype: int64

Strange! There is only one complaint in the entire database.

Investigating the Complaint (Skip in Class)

Let's look a little bit further at this complaint:

In [40]:
ins[ins['type'] == 'complaint']
Out[40]:
score date type
business_id
87440 100 2016-08-01 complaint

A score of 100?! That is odd. What was the restaurant?

In [41]:
ins[ins['type'] == 'complaint'].join(bus)
Out[41]:
score date type name address city state postal_code latitude longitude phone_number
business_id
87440 100 2016-08-01 complaint EL AJI PERUVIAN RESTAURANT 3015 MISSION ST San Francisco CA 94110 NaN NaN +14156587349

This probably deserves further investigation ...

In [42]:
vio.loc[87440]
Out[42]:
date description
business_id
87440 2016-08-01 Low risk vermin infestation
87440 2016-08-01 Inadequate dressing rooms or improper storage ...
In [43]:
vio.loc[87440].iloc[1,1]
Out[43]:
'Inadequate dressing rooms or improper storage of personal items'

And it still got a score of 100? This record is probably an anomaly but it does cause us to question the meaning of these scores.


How frequently are these restaurants inspected?

Group the inspections by the index (the business_id) Drawing

In [44]:
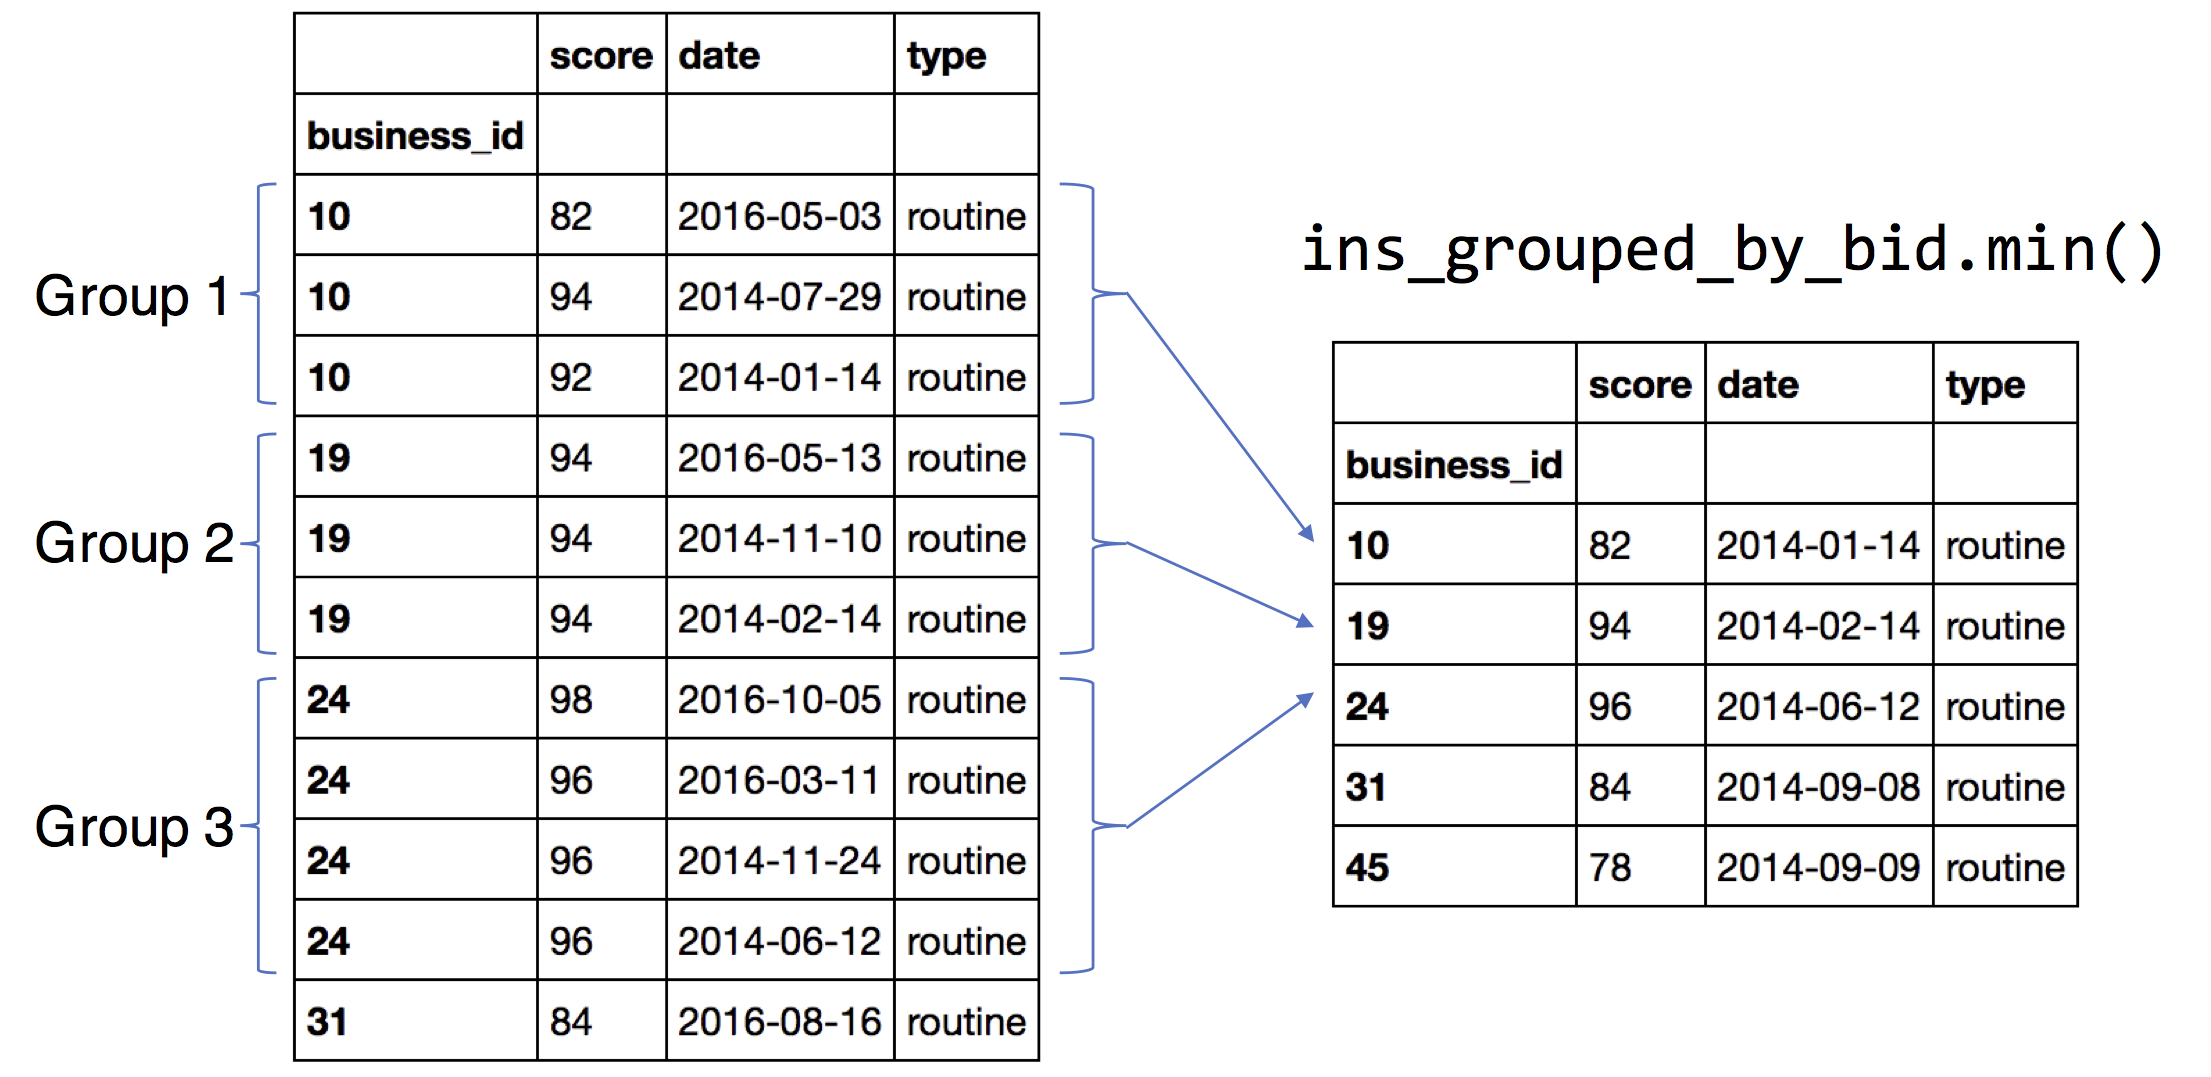
ins_grouped_by_bid = ins.groupby(ins.index)
In [45]:
bus['first_inspect'] = ins_grouped_by_bid['date'].min()
bus['last_inspect'] = ins_grouped_by_bid['date'].max()
bus['num_inspect'] = ins_grouped_by_bid['date'].count()
In [46]:
bus['days_bt_ins'] = (bus['last_inspect'] - bus['first_inspect']).dt.days / (bus['num_inspect'] - 1)
bus['years_bt_ins'] = bus['days_bt_ins'] / 365.0
In [47]:
bus[['years_bt_ins', 'days_bt_ins', 'first_inspect', 'last_inspect', 'num_inspect']].head(3)
Out[47]:
years_bt_ins days_bt_ins first_inspect last_inspect num_inspect
business_id
10 1.150685 420.0 2014-01-14 2016-05-03 3.0
19 1.121918 409.5 2014-02-14 2016-05-13 3.0
24 0.772603 282.0 2014-06-12 2016-10-05 4.0
In [48]:
%matplotlib inline
import seaborn as sns
import matplotlib.pyplot as plt
In [49]:
bus['years_bt_ins'].hist(bins=50)
Out[49]:
<matplotlib.axes._subplots.AxesSubplot at 0x10ec68438>

What patterns do we see?

  1. Two modes at 1.0 and 2.0. Why?

Inspections are required annually. Why longer than 1 year?


Understanding Scores

Our original goal was to understand scores. Let's see what we can find. Since restaurants can have multiple inspections let's look at the most recent.

In [50]:
def most_recent(df):
    return df.sort_values('date', ascending=False).iloc[0]

bus['latest_score'] = ins_grouped_by_bid.apply(most_recent)['score']
bus['mean_score'] = ins_grouped_by_bid['score'].mean()

Let's look at the spread of scores.

In [51]:
bus['latest_score'].hist(bins=10)
Out[51]:
<matplotlib.axes._subplots.AxesSubplot at 0x1110ddb38>
In [52]:
bus['latest_score'].hist(bins=200)
Out[52]:
<matplotlib.axes._subplots.AxesSubplot at 0x1121c2eb8>

The scores seem to be pretty heavily skewed towards 100. Is that good news? There also appears to be a weird clustering around 90. Why?

Score inflation?

In [53]:
bus['latest_score'].describe()
Out[53]:
count    5730.000000
mean       90.359860
std         8.061857
min        52.000000
25%        86.000000
50%        92.000000
75%        96.000000
max       100.000000
Name: latest_score, dtype: float64

What fraction of the restaurants are poor (below 70) by the cities standard?


In [54]:
threshold = 70

fraction = (bus['latest_score'] <= threshold).mean() # <- Why the mean?

print("Less than", str(round(fraction * 100, 2)) + 
      "% of the restaurants have a score of", threshold, "or less.")
Less than 2.17% of the restaurants have a score of 70 or less.

Would you feel comfortable eating at a restaurant that got a score of 90?

What is the Geographic Distribution of Scores?

What data could we use to answer this question?

In [55]:
print("Bus(" + ", ".join(bus.columns) + ")\n")
print("Ins(" + ", ".join(ins.columns) + ")\n")
print("Vio(" + ", ".join(vio.columns) + ")")
Bus(name, address, city, state, postal_code, latitude, longitude, phone_number, first_inspect, last_inspect, num_inspect, days_bt_ins, years_bt_ins, latest_score, mean_score)

Ins(score, date, type)

Vio(date, description)

  • City?
  • Postal Code
  • Latitude & Longitude

Postal Codes (ZIP codes)

What is our coverage over postal codes?

What fraction of businesses don't have a postal code?

In [56]:
bus['postal_code'].isnull().mean()
Out[56]:
0.041013460015835314

Is that acceptable?


Let's look at how the businesses are spread over the postal codes.

In [57]:
zipcounts = bus['postal_code'].value_counts()
zipcounts.name = 'counts'
zipcounts.plot('bar')
Out[57]:
<matplotlib.axes._subplots.AxesSubplot at 0x11205ca90>

What do we observe from above?


Observations?

  1. 94110 seems to have the most inspections.
  2. Messy Data! CA is not a zipcode.
  3. Some postal codes are in extended form.

Visualizing the counts of businesses in each postal code

Compute the number of occurrences for each postal code:

We will use the Folium mapping package. To install it make sure you are in the correct conda environment (e.g., ds100) and then use pip (not conda which is still a few versions behind):

pip install folium
In [58]:
import folium
folium.__version__
Out[58]:
'0.2.1'

We need version 0.2.0 or greater.

In [59]:
import folium
SF_COORDINATES = (37.76, -122.45)
sf_map = folium.Map(location=SF_COORDINATES, zoom_start=12)

#  choropleth : Greek for choro=area + pleth=multitued
sf_map.choropleth(geo_path = "condensed_zipcodes.json", 
                  data = zipcounts,
                  key_on = 'properties.zipcode',
                  threshold_scale = [100, 300, 400, 450, 500, 575],
                  fill_color='YlGn', fill_opacity=0.7, line_opacity=0.5)

sf_map
Out[59]:

Get ZIP Code Labels and Areas

This requires the python area package. In your DS100 conda environment run:

pip
pip install area
In [60]:
# Load my geo graphic data
import json
import numpy as np
import area

with open("condensed_zipcodes.json", "r") as f:
    geojson = json.load(f)

def extract_info(x):
    postal_code = x['properties']['zipcode']
    coords = x['geometry']['coordinates'][0]
    if len(coords) == 1:
        coords = coords[0]
    hectares = area.area(x['geometry']) / (10000.0)
    return (postal_code, hectares, np.mean(coords, axis=0))

# Construct a dataframe with the number of hectares in each zipcode
postal_codes = pd.DataFrame(
    [extract_info(g) for g in geojson['features']],
    columns=['zipcode', 'hectares', 'coords']).set_index('zipcode')

postal_codes.head()
Out[60]:
hectares coords
zipcode
94108 69.880951 [-122.4079474, 37.7914164]
94104 20.714150 [-122.402450875, 37.79189525]
94122 612.142955 [-122.477982706, 37.7598352941]
94130 231.528932 [-122.367345109, 37.8173646353]
94158 270.461338 [-122.38815998, 37.7694004322]
In [61]:
for zipcode, row in postal_codes.iterrows():
    text = '<div style="font-size: 24pt">%s</div>' % zipcode
    sf_map.add_child(folium.Marker(row['coords'][::-1], icon=folium.DivIcon(html=text)))
sf_map
Out[61]:

How does this relate to the regions in SF?


Drawing

Would we expect small zipcodes regions to have as many restaurants as big regions?


Normalizing by ZIP code by area

In [62]:
tmp = pd.DataFrame(zipcounts).join(postal_codes)
density = (tmp['counts'] / tmp['hectares']).dropna()
In [63]:
density.plot(kind='bar')
Out[63]:
<matplotlib.axes._subplots.AxesSubplot at 0x1129037f0>
In [64]:
import folium
SF_COORDINATES = (37.77, -122.45)
sf_map = folium.Map(location=SF_COORDINATES, zoom_start=12)

#choropleth : Greek for choro=area + pleth=multitued
sf_map.choropleth(geo_path = "condensed_zipcodes.json", 
                  data = density,
                  key_on = 'properties.zipcode',
                  fill_color='YlGn', fill_opacity=0.7, line_opacity=0.5)

sf_map
/Users/jegonzal/anaconda3/envs/ds100/lib/python3.5/site-packages/ipykernel/__main__.py:9: FutureWarning: 'threshold_scale' default behavior has changed. Now you get a linear scale between the 'min' and the 'max' of your data. To get former behavior, use folium.utilities.split_six.
Out[64]:

How does this relate to the regions in SF?


Drawing

More Fine Grained Picture

We also have geo-coordinates attached to some of the restaurants. How many are missing?

How many of the entries are missing the latitude or longitude fields?

In [65]:
(bus['latitude'].isnull() | bus['longitude'].isnull()).mean()
Out[65]:
0.43008709422011082

We having missing values for 43% of the businesses. Is that a problem?


Nearly half are missing the latitude or longitude information! Let's look at the locations of those that do have a location.

In [66]:
bus_locations = bus[['name', 'latitude', 'longitude', 'latest_score', 'mean_score']].dropna()

print("There are", len(bus_locations), "businesses with locations.")
There are 3550 businesses with locations.

The following generates a HeatMap of locations where we have collected restaurant data with geo-location information.

In [67]:
import folium
import folium.plugins # The Folium Javascript Map Library

locs = bus_locations[['latitude', 'longitude']].as_matrix()

SF_COORDINATES = (37.76, -122.45)
sf_map = folium.Map(location=SF_COORDINATES, zoom_start=12)
sf_map.add_children(folium.plugins.HeatMap(locs, radius = 10))
sf_map
Out[67]:

Scores broken down by ZIP code

Focus on foodie ZIP codes

Lets define a foodie ZIP codes as one that has at least 200 restaurants.

In [68]:
# foodie_zips = zipcounts[zipcounts > 200].index
foodie_zips = density[density > 0.5].index
In [69]:
foodie_bus = bus[bus['postal_code'].isin(foodie_zips)]
In [70]:
foodie_bus.boxplot(by='postal_code', column='latest_score')
_ = plt.xticks(rotation='vertical')

What are the safest places to eat?

What is the least safe place to eat?

Drawing

Drawing

Another kind of visualization (Skip)

In [71]:
sns.violinplot(x="postal_code", y="latest_score", 
               data=foodie_bus)
_ = plt.grid(b=True, which='major', color='w', linewidth=1.0)
_ = plt.xticks(rotation='vertical')

Why do the scores go above 100?


In [72]:
sns.violinplot(x="postal_code", y="latest_score", 
               data=foodie_bus,
               cut= 0)
_ = plt.grid(b=True, which='major', color='w', linewidth=1.0)
_ = plt.xticks(rotation='vertical')
In [73]:
score_quantiles = bus[bus['postal_code'].isin(foodie_zips)][['postal_code', 'latest_score']].dropna()\
    .groupby('postal_code')['latest_score'].quantile([0.1, 0.25, .5, 0.75, 0.9])

Visualizing the Scores by Zipcode

First we need to get the boundaries of the zip codes for our foody_zips

In [74]:
foodie_geojson = geojson.copy()
foodie_geojson['features'] = [f for f in geojson['features'] if f['properties']['zipcode'] in foodie_zips]

Median scores by zipcode

In [75]:
import folium
SF_COORDINATES = (37.76, -122.45)
sf_map = folium.Map(location=SF_COORDINATES, zoom_start=12)
sf_map.choropleth(geo_str = json.dumps(foodie_geojson), 
                  data = score_quantiles[:, 0.50],
                  key_on = 'properties.zipcode',
                  fill_color='BuPu', fill_opacity=0.7, line_opacity=0.5)
sf_map
/Users/jegonzal/anaconda3/envs/ds100/lib/python3.5/site-packages/ipykernel/__main__.py:7: FutureWarning: 'threshold_scale' default behavior has changed. Now you get a linear scale between the 'min' and the 'max' of your data. To get former behavior, use folium.utilities.split_six.
Out[75]:

Lower 10% Quantile

In [76]:
import folium
SF_COORDINATES = (37.76, -122.45)
sf_map = folium.Map(location=SF_COORDINATES, zoom_start=12)
sf_map.choropleth(geo_str = json.dumps(foodie_geojson), 
                  data = score_quantiles[:, 0.1],
                  key_on = 'properties.zipcode',
                  fill_color='BuPu', fill_opacity=0.7, line_opacity=0.5)
sf_map
/Users/jegonzal/anaconda3/envs/ds100/lib/python3.5/site-packages/ipykernel/__main__.py:7: FutureWarning: 'threshold_scale' default behavior has changed. Now you get a linear scale between the 'min' and the 'max' of your data. To get former behavior, use folium.utilities.split_six.
Out[76]:

ZIP Code with most spread (Interquartile Range)

In [77]:
import folium
SF_COORDINATES = (37.76, -122.45)
sf_map = folium.Map(location=SF_COORDINATES, zoom_start=12)
sf_map.choropleth(geo_str = json.dumps(foodie_geojson), 
                  data = score_quantiles[:, 0.75] - score_quantiles[:, 0.25],
                  key_on = 'properties.zipcode',
                  fill_color='BuPu', fill_opacity=0.7, line_opacity=0.5)
sf_map
/Users/jegonzal/anaconda3/envs/ds100/lib/python3.5/site-packages/ipykernel/__main__.py:7: FutureWarning: 'threshold_scale' default behavior has changed. Now you get a linear scale between the 'min' and the 'max' of your data. To get former behavior, use folium.utilities.split_six.
Out[77]:

Low Scoring Locations

In [78]:
SF_COORDINATES = (37.76, -122.45)
sf_map = folium.Map(location=SF_COORDINATES, zoom_start=12)

cluster = folium.MarkerCluster()

for _, row in bus_locations[bus_locations['latest_score'] < 70.0].iterrows():
    cluster.add_child(folium.Marker(location=[row['latitude'], row['longitude']], 
                                    popup=(row['name'] +": " + str(row['latest_score']))))
sf_map.add_child(cluster)
sf_map

sf_map
Out[78]:

What kinds of violations are correlated with low scores?

In [79]:
vio.head()
Out[79]:
date description
business_id
10 2016-05-03 High risk food holding temperature [ date vi...
10 2016-05-03 High risk vermin infestation
10 2016-05-03 Unapproved or unmaintained equipment or utensils
10 2016-05-03 No thermometers or uncalibrated thermometers
In [80]:
vio['description'].value_counts()
Out[80]:
Unclean or degraded floors walls or ceilings                                                                    986
Moderate risk food holding temperature                                                                          661
Unapproved or unmaintained equipment or utensils                                                                649
Inadequate and inaccessible handwashing facilities                                                              557
Wiping cloths not clean or properly stored or inadequate sanitizer                                              527
Improper food storage                                                                                           492
Inadequately cleaned or sanitized food contact surfaces                                                         491
Food safety certificate or food handler card not available                                                      407
Foods not protected from contamination                                                                          381
Moderate risk vermin infestation                                                                                373
Unclean nonfood contact surfaces                                                                                352
Low risk vermin infestation                                                                                     314
Inadequate food safety knowledge or lack of certified food safety manager                                       294
Permit license or inspection report not posted                                                                  290
Improper storage of equipment utensils or linens                                                                245
Improper or defective plumbing                                                                                  225
High risk food holding temperature                                                                              196
Inadequate warewashing facilities or equipment                                                                  184
Unclean or unsanitary food contact surfaces                                                                     151
Inadequate ventilation or lighting                                                                              148
No thermometers or uncalibrated thermometers                                                                    144
Improper thawing methods                                                                                        122
Unclean hands or improper use of gloves                                                                         121
Improper storage use or identification of toxic substances                                                      114
Insufficient hot water or running water                                                                         107
Improper cooling methods                                                                                        105
High risk vermin infestation                                                                                     78
Inadequate dressing rooms or improper storage of personal items                                                  65
Inadequate procedures or records for time as a public health control                                             54
Improper food labeling or menu misrepresentation                                                                 53
                                                                                                               ... 
Permit license or inspection report not posted  [ date violation corrected: 7/29/2014 ]                           1
Improper storage of equipment utensils or linens  [ date violation corrected: 6/26/2014 ]                         1
Improper cooling methods  [ date violation corrected: 10/9/2016 ]                                                 1
Food safety certificate or food handler card not available  [ date violation corrected: 8/14/2015 ]               1
Improper cooling methods  [ date violation corrected: 8/14/2015 ]                                                 1
Non service animal  [ date violation corrected: 3/25/2014 ]                                                       1
High risk vermin infestation  [ date violation corrected: 10/25/2014 ]                                            1
Unclean unmaintained or improperly constructed toilet facilities  [ date violation corrected: 11/10/2016 ]        1
Improper food labeling or menu misrepresentation  [ date violation corrected: 8/18/2016 ]                         1
Improper storage use or identification of toxic substances  [ date violation corrected: 11/5/2015 ]               1
High risk food holding temperature   [ date violation corrected: 11/25/2015 ]                                     1
Unclean or degraded floors walls or ceilings  [ date violation corrected: 9/12/2016 ]                             1
Improper thawing methods   [ date violation corrected: 3/14/2014 ]                                                1
Employee eating or smoking  [ date violation corrected: 8/2/2016 ]                                                1
Improper storage use or identification of toxic substances  [ date violation corrected: 8/17/2016 ]               1
Moderate risk vermin infestation  [ date violation corrected: 4/17/2015 ]                                         1
Improper food storage  [ date violation corrected: 7/8/2015 ]                                                     1
Wiping cloths not clean or properly stored or inadequate sanitizer  [ date violation corrected: 11/12/2014 ]      1
No thermometers or uncalibrated thermometers   [ date violation corrected: 6/6/2014 ]                             1
Unapproved food source  [ date violation corrected: 3/31/2016 ]                                                   1
Improper or defective plumbing  [ date violation corrected: 7/30/2015 ]                                           1
Improper storage of equipment utensils or linens  [ date violation corrected: 9/24/2015 ]                         1
Contaminated or adulterated food  [ date violation corrected: 6/26/2015 ]                                         1
Inadequate warewashing facilities or equipment  [ date violation corrected: 9/2/2016 ]                            1
No person in charge of food facility  [ date violation corrected: 12/5/2014 ]                                     1
Improper thawing methods   [ date violation corrected: 12/22/2014 ]                                               1
Moderate risk food holding temperature   [ date violation corrected: 9/22/2015 ]                                  1
No thermometers or uncalibrated thermometers   [ date violation corrected: 7/28/2016 ]                            1
Inadequate and inaccessible handwashing facilities  [ date violation corrected: 6/16/2015 ]                       1
Inadequate sewage or wastewater disposal  [ date violation corrected: 5/5/2016 ]                                  1
Name: description, dtype: int64

Dirty data!

It looks like the description field has data information! How many descriptions are there?

In [81]:
len(vio['description'].value_counts())
Out[81]:
15072

We can use regular expressions to extract dates and remove the:

[ date violation corrected: ##/#/#### ]

string

In [82]:
vio['resolved'] = pd.to_datetime(vio['description'].str.extract("(\d+\/\d+\/\d+)", expand=False))
vio['desc'] = vio['description'].str.replace("\[.*\]","").str.strip()

Now let's look at all the value counts

In [83]:
len(vio['desc'].value_counts())
Out[83]:
68
In [84]:
print(vio['desc'].value_counts().to_string())
Unclean or degraded floors walls or ceilings                                 3559
Moderate risk food holding temperature                                       2809
Inadequate and inaccessible handwashing facilities                           2613
Unapproved or unmaintained equipment or utensils                             2450
Inadequately cleaned or sanitized food contact surfaces                      2325
Wiping cloths not clean or properly stored or inadequate sanitizer           2304
Improper food storage                                                        2163
Foods not protected from contamination                                       1907
Unclean nonfood contact surfaces                                             1861
High risk food holding temperature                                           1642
Moderate risk vermin infestation                                             1532
Food safety certificate or food handler card not available                   1254
Improper storage of equipment utensils or linens                             1136
Inadequate food safety knowledge or lack of certified food safety manager    1100
Permit license or inspection report not posted                               1035
Unclean or unsanitary food contact surfaces                                  1003
Low risk vermin infestation                                                   911
Improper cooling methods                                                      789
Improper or defective plumbing                                                769
High risk vermin infestation                                                  742
Unclean hands or improper use of gloves                                       737
Improper thawing methods                                                      647
Inadequate warewashing facilities or equipment                                595
Inadequate ventilation or lighting                                            589
No thermometers or uncalibrated thermometers                                  544
Improper storage use or identification of toxic substances                    531
Insufficient hot water or running water                                       526
Inadequate dressing rooms or improper storage of personal items               260
Inadequate procedures or records for time as a public health control          237
Unclean unmaintained or improperly constructed toilet facilities              227
No hot water or running water                                                 204
Contaminated or adulterated food                                              193
Employee eating or smoking                                                    161
Improper food labeling or menu misrepresentation                              157
Other low risk violation                                                      154
Improper reheating of food                                                    133
Inadequate or unsanitary refuse containers or area or no garbage service      132
Worker safety hazards                                                         103
Noncompliance with HAACP plan or variance                                     100
Inadequate sewage or wastewater disposal                                       96
Other moderate risk violation                                                  79
Unauthorized or unsafe use of time as a public health control measure          74
Unsanitary employee garments hair or nails                                     68
Food in poor condition                                                         68
Noncompliance with shell fish tags or display                                  55
No plan review or Building Permit                                              40
Sewage or wastewater contamination                                             39
Unpermitted food facility                                                      36
No person in charge of food facility                                           32
Inadequate HACCP plan record keeping                                           29
Unapproved  living quarters in food facility                                   28
Unapproved food source                                                         26
Other high risk violation                                                      25
Consumer advisory not provided for raw or undercooked foods                    19
Non service animal                                                             19
Improperly washed fruits and vegetables                                        12
Improper cooking time or temperatures                                          10
Mobile food facility with unapproved operating conditions                      10
Reservice of previously served foods                                            9
Unreported or unrestricted ill employee with communicable disease               6
Discharge from employee nose mouth or eye                                       6
Prohibited food served to sensitive population                                  4
Mobile food facility not operating with an approved commissary                  3
Noncompliance with Gulf Coast oyster regulation                                 3
Noncompliance with Cottage Food Operation                                       2
Improperly displayed mobile food permit or signage                              2
Mobile food facility HCD insignia unavailable                                   1
No restroom facility within 200 feet of mobile food facility                    1

Restaurants with many violations might be a bad sign:

In [85]:
bus['num_violations'] = vio.index.value_counts()

What are the worst offenders?

In [86]:
bus.sort_values('num_violations', ascending=False)[['name', 'num_violations', 'postal_code']].head(10)
Out[86]:
name num_violations postal_code
business_id
75139 HAKKA RESTAURANT 42.0 94121
489 DOL-HO RESTAURANT 39.0 94133
60354 TAQUERIA CASTILLO B 38.0 94102
3115 YEE'S RESTAURANT 37.0 94133
70996 HONG KONG LOUNGE 36.0 94121
1833 ROGUE ALES PUBLIC HOUSE 36.0 94133
71385 YAMA SUSHI RESTAURANT 34.0 94132
76547 QUAN PHO INC 34.0 94112
37882 FIRST CAKE 34.0 94121
2945 NEW SUN HONG KONG RESTAURANT 34.0 94133

Is that fair?


what about age?

That might not be fair if the restaurant is old. Let's look at at the violations on the latest inspection.

In [87]:
vio_bus = vio.join(bus['last_inspect'])
recent_vio = vio_bus[vio_bus['date'] >= vio_bus['last_inspect']]
bus['num_recent_violations'] = recent_vio.index.value_counts()
In [88]:
bus.sort_values('num_recent_violations', ascending=False)[['name', 'num_violations', 'num_recent_violations']].head(10)
Out[88]:
name num_violations num_recent_violations
business_id
78328 GOLDEN WOK 32.0 20.0
82134 HARBOR VILLA RESTAURANT 16.0 16.0
521 CALIFORNIA CRISP 24.0 15.0
87492 NAN KING ROAD BISTRO 13.0 13.0
68672 KAMA SUSHI SOMA 27.0 13.0
66961 MI TIERRA MARKET 19.0 13.0
1641 MARTHA & BROS. COFFEE CO 19.0 12.0
35026 MANGOSTEEN 17.0 12.0
77548 POC-CHUC RESTAURANT 20.0 12.0
83351 CITY SUPER 20.0 12.0

What about unresolved recent violations?

In [89]:
bus['num_unresolved_violations'] = recent_vio[recent_vio['resolved'].isnull()].index.value_counts()
In [90]:
bus.sort_values('num_unresolved_violations', ascending=False)[[
        'name', 'num_violations', 'num_recent_violations','num_unresolved_violations']].head(10)
Out[90]:
name num_violations num_recent_violations num_unresolved_violations
business_id
3491 BORODUDUR RESTAURANT 16.0 11.0 11.0
6654 HIEP-THANH MARKET 27.0 11.0 11.0
3875 MARINA SUPER 19.0 11.0 11.0
2764 AL-HAMRA 21.0 10.0 10.0
35447 SPARKY'S PIZZA & DINER 15.0 10.0 10.0
19003 PANCHITAS RESTAURANT 18.0 10.0 10.0
2331 JADE CAFE 27.0 10.0 10.0
71012 LITTLE PARIS 18.0 10.0 10.0
17411 OYE MANAGUA 23.0 9.0 9.0
4607 NEW GOLDEN DAISY 22.0 9.0 9.0

Lets Look at these violations on a map

75th Quantile Number of Recent Violations

In [91]:
score_quantiles2 = bus[['postal_code', 'num_recent_violations']].dropna()\
    .groupby('postal_code')['num_recent_violations'].quantile([0.25, .5, 0.75])

SF_COORDINATES = (37.76, -122.45)
sf_map = folium.Map(location=SF_COORDINATES, zoom_start=12)
sf_map.choropleth(geo_str = json.dumps(foodie_geojson), 
                  data = score_quantiles2[:, 0.75],
                  key_on = 'properties.zipcode',
                  fill_color='BuPu', fill_opacity=0.7, line_opacity=0.5)
sf_map
/Users/jegonzal/anaconda3/envs/ds100/lib/python3.5/site-packages/ipykernel/__main__.py:8: FutureWarning: 'threshold_scale' default behavior has changed. Now you get a linear scale between the 'min' and the 'max' of your data. To get former behavior, use folium.utilities.split_six.
Out[91]:
In [92]:
SF_COORDINATES = (37.76, -122.45)
sf_map = folium.Map(location=SF_COORDINATES, zoom_start=12)
bus_loc = bus[~bus['latitude'].isnull()]
for bid, row in bus_loc[bus_loc['num_recent_violations'] > 7].iterrows():
    msg = "[" + str(bid) + "] " + row['name'] +": " + str(row['latest_score']) + "--> " + \
    " -- ".join(recent_vio.loc[bid]['desc'].values)
    sf_map.add_child(folium.Marker(location=[row['latitude'], row['longitude']], 
                                    popup=msg))
sf_map
Out[92]:

What are the Violations of high-scoring restaurants?

Recall:

In [93]:
bus['latest_score'].dropna().describe()
Out[93]:
count    5730.000000
mean       90.359860
std         8.061857
min        52.000000
25%        86.000000
50%        92.000000
75%        96.000000
max       100.000000
Name: latest_score, dtype: float64

Let's look at restaurants that scored above 96

In [94]:
tmp = recent_vio.join(bus['latest_score'])
tmp[tmp['latest_score'] >= 96.].groupby('desc')['desc'].count().sort_values(ascending=False)
Out[94]:
desc
Unclean or degraded floors walls or ceilings                                 186
Wiping cloths not clean or properly stored or inadequate sanitizer           116
Unapproved or unmaintained equipment or utensils                             106
Moderate risk food holding temperature                                        96
Improper food storage                                                         86
Inadequate and inaccessible handwashing facilities                            78
Inadequately cleaned or sanitized food contact surfaces                       67
Food safety certificate or food handler card not available                    59
Unclean nonfood contact surfaces                                              57
Permit license or inspection report not posted                                55
Improper storage of equipment utensils or linens                              52
Low risk vermin infestation                                                   51
Improper or defective plumbing                                                50
Moderate risk vermin infestation                                              44
Inadequate warewashing facilities or equipment                                42
Foods not protected from contamination                                        36
Inadequate food safety knowledge or lack of certified food safety manager     27
Insufficient hot water or running water                                       24
No thermometers or uncalibrated thermometers                                  18
Improper storage use or identification of toxic substances                    16
Inadequate dressing rooms or improper storage of personal items               14
Other low risk violation                                                      11
Noncompliance with HAACP plan or variance                                     10
Improper food labeling or menu misrepresentation                              10
Inadequate ventilation or lighting                                             9
Unclean unmaintained or improperly constructed toilet facilities               8
Worker safety hazards                                                          7
Inadequate procedures or records for time as a public health control           5
Inadequate HACCP plan record keeping                                           5
Unpermitted food facility                                                      5
Employee eating or smoking                                                     4
Noncompliance with shell fish tags or display                                  3
High risk food holding temperature                                             3
Unclean or unsanitary food contact surfaces                                    3
Inadequate or unsanitary refuse containers or area or no garbage service       2
Other moderate risk violation                                                  2
Inadequate sewage or wastewater disposal                                       2
Unapproved  living quarters in food facility                                   2
Unclean hands or improper use of gloves                                        2
No hot water or running water                                                  1
High risk vermin infestation                                                   1
Unsanitary employee garments hair or nails                                     1
Reservice of previously served foods                                           1
Improper cooling methods                                                       1
Improper thawing methods                                                       1
Improperly washed fruits and vegetables                                        1
Non service animal                                                             1
No plan review or Building Permit                                              1
Contaminated or adulterated food                                               1
Name: desc, dtype: int64

Violations of Low Scoring Restaurants

In [95]:
tmp = recent_vio.join(bus['latest_score'])
tmp[tmp['latest_score'] <= 70.].groupby('desc')['desc'].count().sort_values(ascending=False)
Out[95]:
desc
High risk food holding temperature                                           82
Foods not protected from contamination                                       77
Unclean or degraded floors walls or ceilings                                 71
Inadequate and inaccessible handwashing facilities                           61
Unapproved or unmaintained equipment or utensils                             59
High risk vermin infestation                                                 59
Unclean or unsanitary food contact surfaces                                  54
Inadequate food safety knowledge or lack of certified food safety manager    53
Inadequately cleaned or sanitized food contact surfaces                      52
Unclean hands or improper use of gloves                                      51
Improper thawing methods                                                     50
Moderate risk food holding temperature                                       41
Improper cooling methods                                                     40
Improper food storage                                                        40
Wiping cloths not clean or properly stored or inadequate sanitizer           39
Moderate risk vermin infestation                                             38
Unclean nonfood contact surfaces                                             34
Contaminated or adulterated food                                             30
No thermometers or uncalibrated thermometers                                 26
Permit license or inspection report not posted                               25
Improper storage use or identification of toxic substances                   21
Improper or defective plumbing                                               20
Food safety certificate or food handler card not available                   18
Improper storage of equipment utensils or linens                             17
Low risk vermin infestation                                                  13
Inadequate ventilation or lighting                                           13
Insufficient hot water or running water                                      11
Inadequate warewashing facilities or equipment                               11
Inadequate sewage or wastewater disposal                                     10
Inadequate or unsanitary refuse containers or area or no garbage service      7
Employee eating or smoking                                                    7
Sewage or wastewater contamination                                            6
Improper reheating of food                                                    5
No hot water or running water                                                 5
Improper food labeling or menu misrepresentation                              5
Inadequate procedures or records for time as a public health control          4
Noncompliance with HAACP plan or variance                                     3
Unclean unmaintained or improperly constructed toilet facilities              3
No person in charge of food facility                                          3
Food in poor condition                                                        3
Inadequate dressing rooms or improper storage of personal items               2
Other low risk violation                                                      2
Unauthorized or unsafe use of time as a public health control measure         2
Noncompliance with Cottage Food Operation                                     1
Noncompliance with shell fish tags or display                                 1
Reservice of previously served foods                                          1
Mobile food facility with unapproved operating conditions                     1
Noncompliance with Gulf Coast oyster regulation                               1
Consumer advisory not provided for raw or undercooked foods                   1
Name: desc, dtype: int64

If you have the same violations do you have the same score?

In [96]:
features = pd.get_dummies(recent_vio['desc']).groupby(recent_vio.index).sum()
# training_data = bus[['latest_score', 'num_recent_violations']]\
#     .join(features)
training_data = bus[['latest_score']].join(features)
training_data = training_data.dropna()
In [97]:
grouped_by_vio = training_data.groupby(list(features.columns))
res = pd.DataFrame({
    'count': grouped_by_vio['latest_score'].count().values,
    'mean': grouped_by_vio['latest_score'].mean().values,
    'var': grouped_by_vio['latest_score'].var().values
})
res[res['count'] > 25]
Out[97]:
count mean var
1 47 98.000000 0.000000
9 78 98.000000 0.000000
32 40 98.000000 0.000000
90 41 96.195122 0.560976
107 92 95.836957 2.225872
108 26 94.000000 0.000000
229 62 96.000000 0.000000
268 26 92.000000 0.000000
474 68 96.000000 0.000000
520 26 92.615385 4.726154
915 29 97.068966 25.137931
1021 39 98.000000 0.000000
1583 30 93.233333 1.633333
1908 34 95.764706 0.912656

Building a Predictive Model

We could try to build a regressive model to identify how violations might contribute to the final score.

In [98]:
X = training_data.drop('latest_score', axis=1).as_matrix()
Y = training_data['latest_score'].as_matrix()

How much data do we have?

In [99]:
print(X.shape)
(4830, 65)
In [100]:
import sklearn
import sklearn.model_selection
(Xtr, Xte, Ytr, Yte) = sklearn.model_selection.train_test_split(X,Y, test_size=.1)
In [101]:
import sklearn.linear_model
#model = sklearn.linear_model.LinearRegression()
model = sklearn.linear_model.LassoCV(eps=0.000001, n_alphas=1000, max_iter=50000, fit_intercept=True)
model.fit(Xtr, Ytr)
print("The R^2 value:", model.score(Xte, Yte))
The R^2 value: 0.935394392538

Listing the coefficient of the model

The most negative coefficient determine the the violations that most contributed to a reduction in score.

In [102]:
feature_weights = pd.DataFrame({
        'features': training_data.drop('latest_score', axis=1).columns, 
        'weights': model.coef_})
print(feature_weights.sort_values('weights'))
                                             features   weights
33  Mobile food facility with unapproved operating... -7.694119
9               Improper cooking time or temperatures -7.228079
52                             Unapproved food source -7.044778
54  Unauthorized or unsafe use of time as a public... -6.696624
61  Unreported or unrestricted ill employee with c... -6.596896
58        Unclean or unsanitary food contact surfaces -6.525649
14                         Improper reheating of food -6.512154
8                        High risk vermin infestation -6.486433
10                           Improper cooling methods -6.483540
36                      No hot water or running water -6.358525
55            Unclean hands or improper use of gloves -6.345138
7                  High risk food holding temperature -6.324212
1                    Contaminated or adulterated food -6.311102
45                          Other high risk violation -5.925851
50                 Sewage or wastewater contamination -5.631901
49               Reservice of previously served foods -5.384052
42    Noncompliance with Gulf Coast oyster regulation -4.626733
26           Inadequate sewage or wastewater disposal -4.332132
41          Noncompliance with Cottage Food Operation -4.321874
43          Noncompliance with HAACP plan or variance -4.034720
17                           Improper thawing methods -3.988688
2           Discharge from employee nose mouth or eye -3.946798
6              Foods not protected from contamination -3.922273
21  Inadequate and inaccessible handwashing facili... -3.894855
32      Mobile food facility HCD insignia unavailable -3.885643
44      Noncompliance with shell fish tags or display -3.835800
29  Inadequately cleaned or sanitized food contact... -3.688618
3                          Employee eating or smoking -3.682846
35                   Moderate risk vermin infestation -3.674774
34             Moderate risk food holding temperature -3.610771
..                                                ...       ...
47                      Other moderate risk violation -2.708247
19            Improperly washed fruits and vegetables -2.440374
51       Unapproved  living quarters in food facility -2.314820
16  Improper storage use or identification of toxi... -2.158376
39       No thermometers or uncalibrated thermometers -2.153206
37               No person in charge of food facility -2.146354
46                           Other low risk violation -2.129569
27                 Inadequate ventilation or lighting -2.084141
13                     Improper or defective plumbing -2.013531
15   Improper storage of equipment utensils or linens -2.005444
22  Inadequate dressing rooms or improper storage ... -1.992388
28     Inadequate warewashing facilities or equipment -1.909698
12                              Improper food storage -1.885891
60                          Unpermitted food facility -1.879470
31                        Low risk vermin infestation -1.874897
5   Food safety certificate or food handler card n... -1.849792
62         Unsanitary employee garments hair or nails -1.848149
57       Unclean or degraded floors walls or ceilings -1.831330
56                   Unclean nonfood contact surfaces -1.806200
38                  No plan review or Building Permit -1.796837
48     Permit license or inspection report not posted -1.730579
63  Wiping cloths not clean or properly stored or ... -1.685951
64                              Worker safety hazards -1.554917
53   Unapproved or unmaintained equipment or utensils -1.518245
20               Inadequate HACCP plan record keeping -1.432978
11   Improper food labeling or menu misrepresentation -1.423454
59  Unclean unmaintained or improperly constructed... -1.380122
24  Inadequate or unsanitary refuse containers or ... -0.841134
40                                 Non service animal  0.616388
18  Improperly displayed mobile food permit or sig...  0.801769

[65 rows x 2 columns]

Done! (Not Really)

There are a lot of questions we left unanswered. The data for other cities is available and we didn't even begin to answer the questions about how food safety is changing.